Wind, temperature and rainfall graph Luke Howard
Product images of Wind, temperature and rainfall graph


Sizing information
| Overall size (inc frame) | x cm ( x in) |
| Depth | cm (in) |
| Artwork | x cm ( x in) |
| Border (mount) |
cm
top/bottom
(in)
cm left/right (in) |
| The paper size of our wall art shipped from the US is sized to the nearest inch. | |
 zoom
zoom
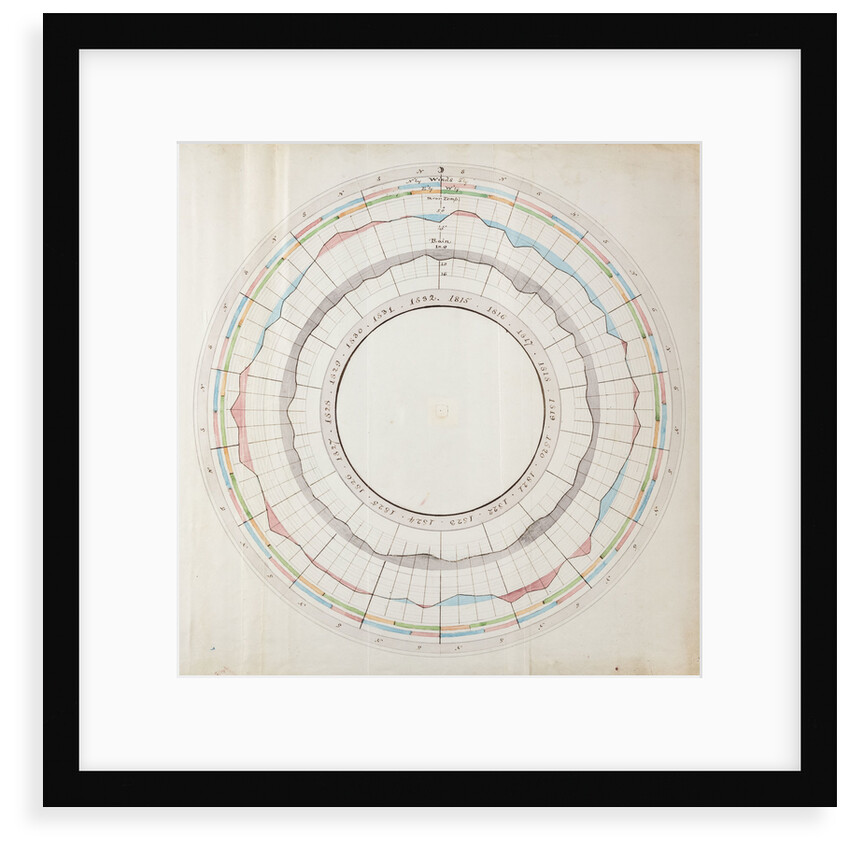
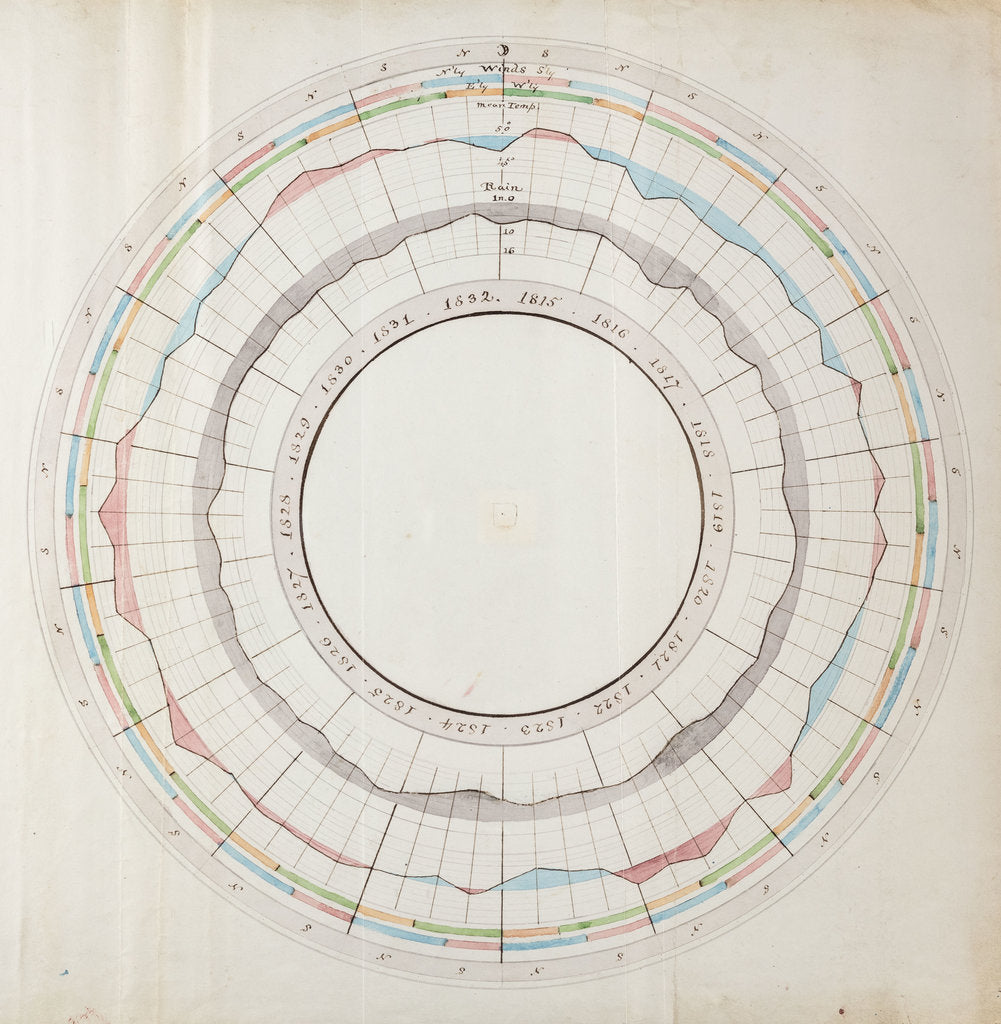
Wind, temperature and rainfall graph
Circular diagram detailing prevailing wind directions, rain depth, and mean temperature over a period of eighteen years, 1815-1832, in London. The innermost circle details the year, followed by the average rain depth, followed by the average temperature, followed by wind direction, followed by lunar position.
A line graph is used to indicate the average rain depth and temperature, while different coloured bars - green, pink, yellow and blue - are used to represent the different directions of wind.
Diagram 4 from a paper sent to the Royal Society by Luke Howard, ‘On the proportions of the prevailing winds, mean temperature and depth of rains, in the climate of London’.
- Image reference: RS-14193
- ©The Royal Society
Discover more
More by the artist Luke Howard.
Our framed prints
Every framed picture is created by hand in our workshop by specialist framers.
Black, white, brown, silver, gold or natural frames available, supplied ready to hang.
All our frames have a smooth satin finish, and measure 20mm (front face) by 23mm (depth from wall).
Read more about our framed art prints.
Manufactured in the UK
All products are printed in the UK, using the latest digital presses and a giclée printmaking process.
We only use premium branded inks, and colours are independently verified to last between 100 and 200 years.
Delivery and returns
We print everything to order so delivery times may vary but all framed pictures are despatched within 5-7 days via courier or recorded mail.
Delivery to the UK is £10 for a single framed print.
We will happily replace your order if everything isn’t 100% perfect.